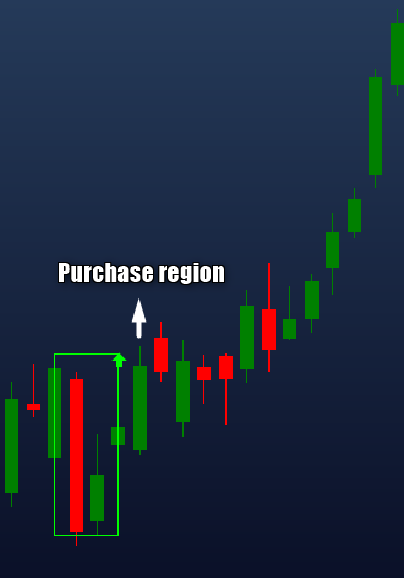
Created by Nicolas Darvas, the Darvas Box is a support and resistance indicator. It aims to define price targets for placing buy and sell trades by drawing a series of boxes over the highs and lows of the candlesticks. Two horizontal lines are plotted: an upper line representing the resistance level, and a lower line representing the support level. These lines bound the box.
Once a green box forms and price breaks out above resistance, it is considered a buy signal.
Similarly, if price breaks below the support of a red box, it is a sell signal.
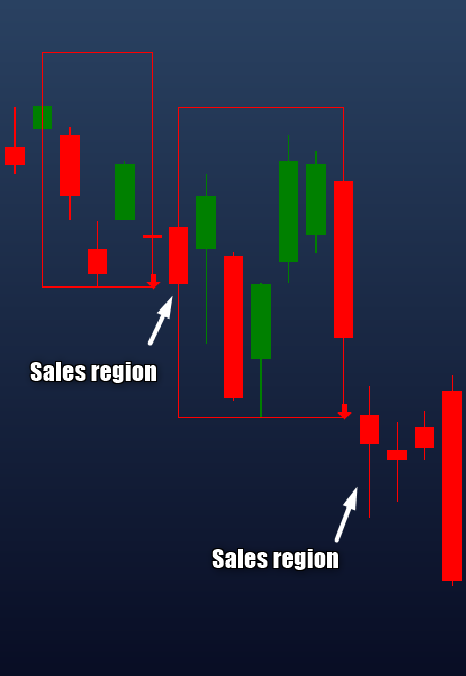
Similarly, if price breaks below the support of a red box, it is a sell signal.
The calculation involves a 5-step algorithm to track top and bottom prices. If, at any step before level 5, both the high and low prices exceed previous values, the box expands. If expansion occurs before level 5, the algorithm resets to a previous level and follows the same logic of grouping candlesticks within a region based on rapid price fluctuation. Conversely, if the price remains within the high and low limits through level 5, the box closes as soon as the price moves beyond these values, whether to the upside or downside. In summary, the algorithm steps continuously update the high and low prices, and the box expands if these values are exceeded before level 5. Otherwise, prices remain within the established boundaries, and the box closes when a breakout above the high or below the low occurs.
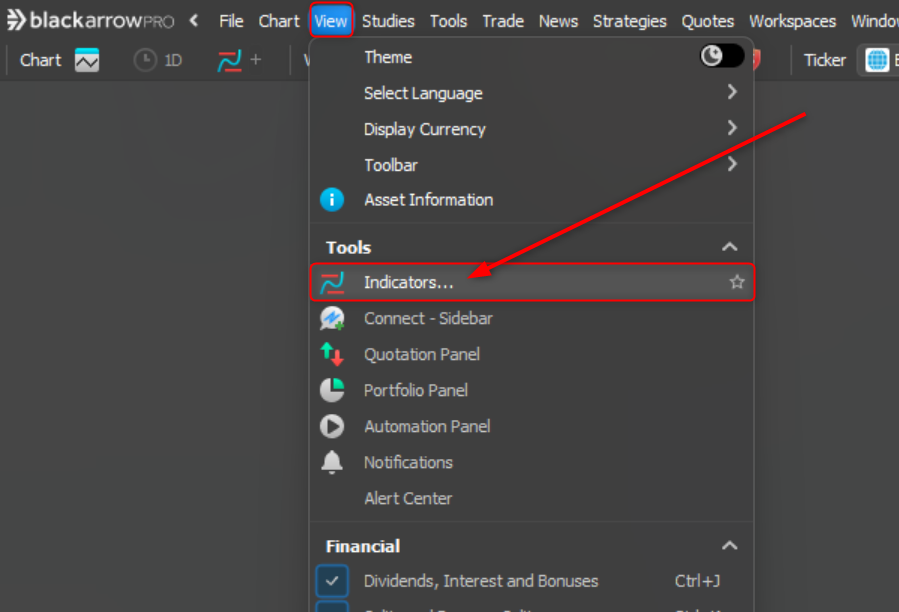
To add the Darvas Box indicator to the chart, go to the View menu and click Indicators:
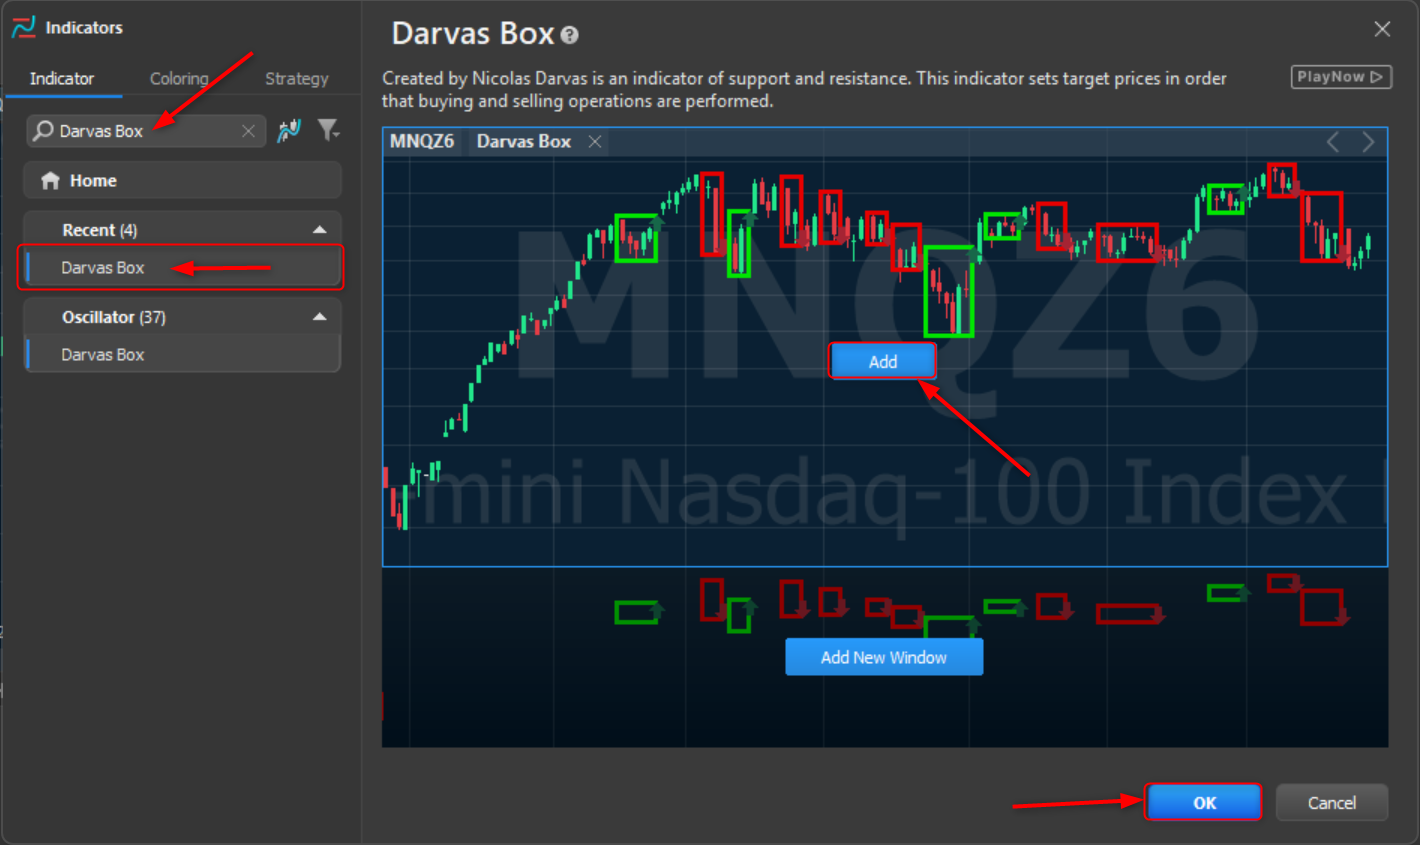
Search for the indicator in question and click to insert:
Was this content helpful?
Please rate us down below.
Was this content helpful?
Please rate us down below.